Platform
Dashboard
Overview of the SkyPort web dashboard and what it is meant to show.
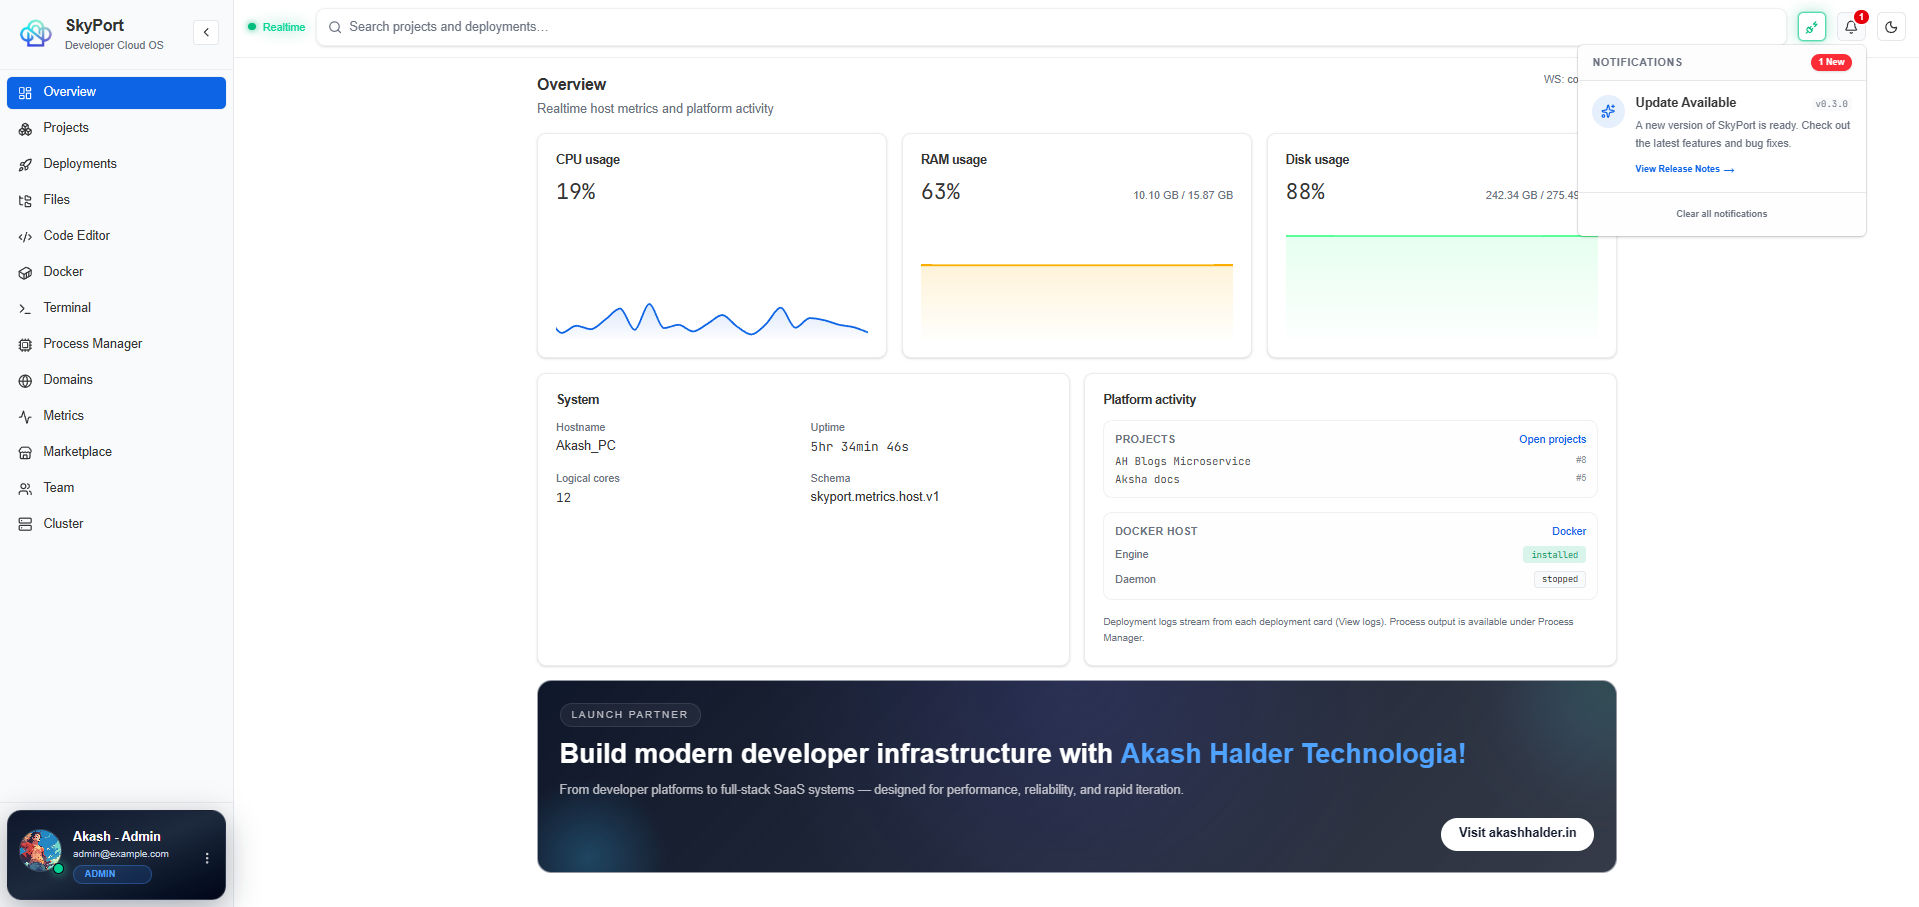
The dashboard is the embedded web control surface for SkyPort. It is meant to give you a quick read on services, host health, deployments, and operator actions without forcing you into the CLI for everything.
What The Dashboard Covers
- Project and deployment overviews
- Container and process status
- Host metrics
- Marketplace catalog access
- Logs and operator workflows
What To Expect
The dashboard is a control plane, not a marketing page. The content should stay operational and factual:
- show current service state
- show recent activity or health information
- expose links to the workflows that matter most
- avoid inventing features the backend does not expose
Related CLI Workflows
terminal
skyport status
skyport project list
skyport docker ps
skyport pm2 list
skyport logs <deployment-id>
Operator Mental Model
Think of the dashboard as a read-heavy, action-ready summary of the backend API:
- Health and metrics come from the Go backend
- Docker and PM2 actions are surfaced through specific modules
- SSH and deployment actions remain available through the CLI
Next
- Read Monitoring for host and runtime metrics.
- Open Services for the service-level view.
- Review Architecture if you want the system layout.