Platform
Monitoring
Host metrics and operational monitoring in SkyPort.
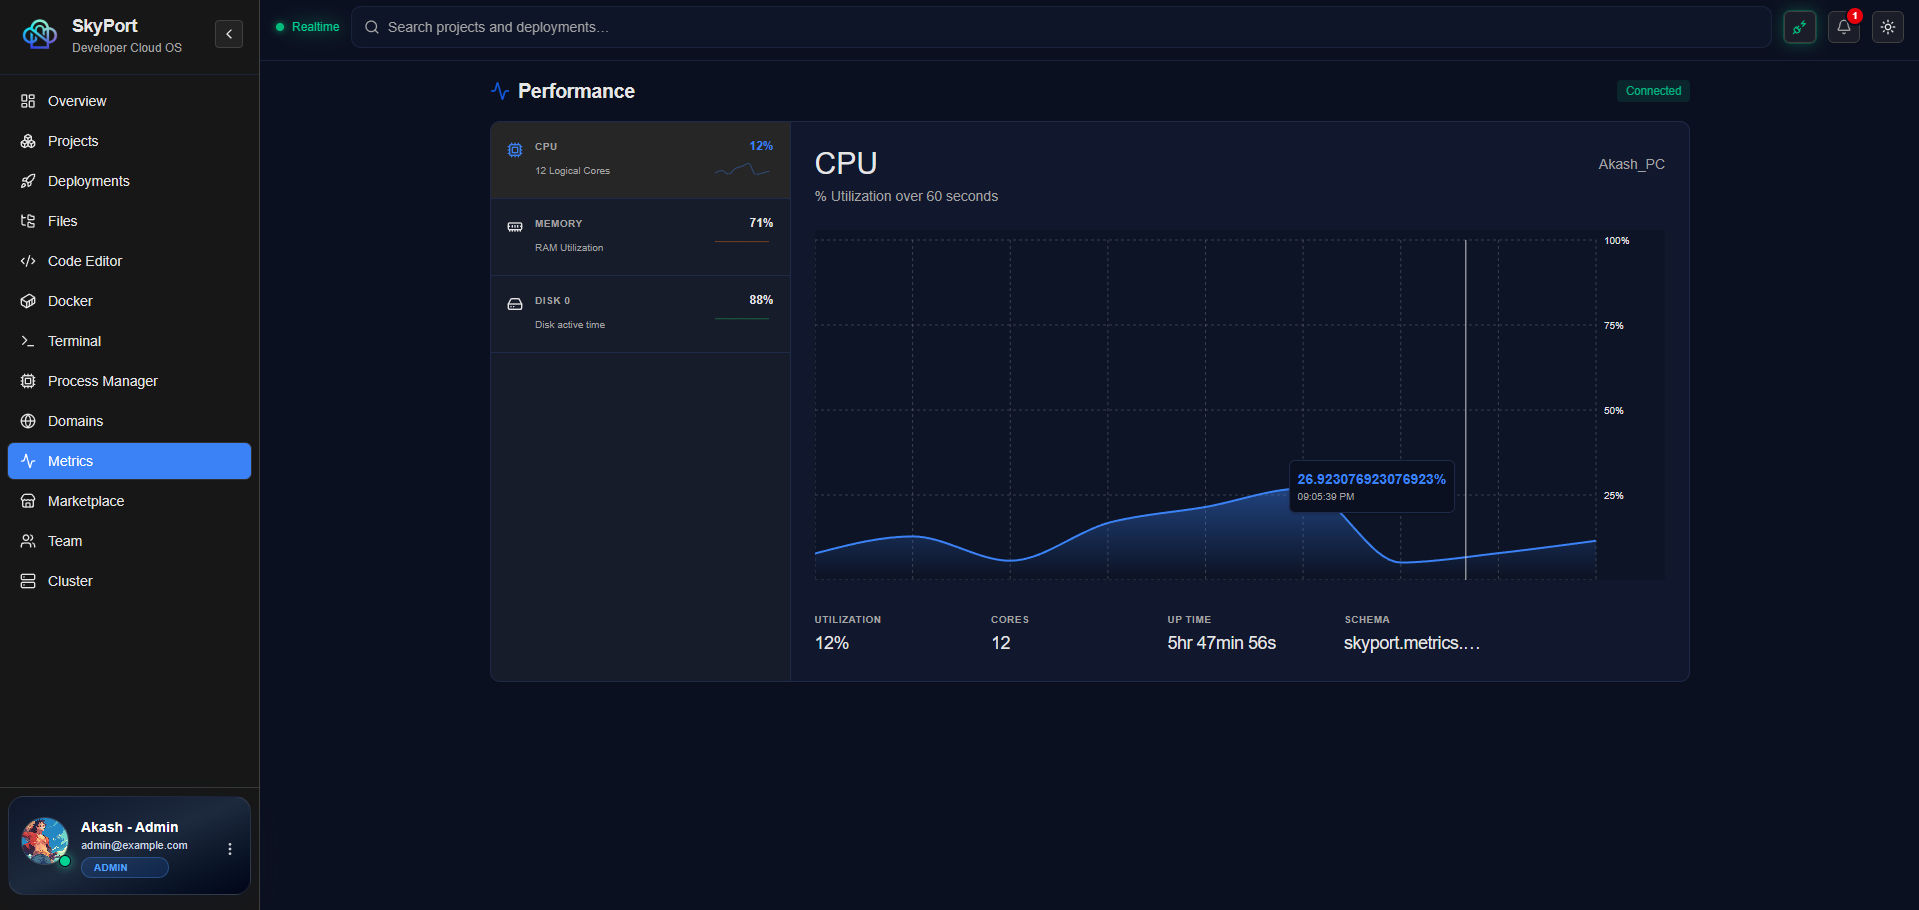
SkyPort exposes host monitoring through the backend metrics service and the live dashboard/TUI surfaces.
What Is Measured
- CPU usage
- Memory usage
- Disk usage
- Host identity and uptime context
- Deployment status when a deployment is selected in the UI or CLI
CLI Check
terminal
skyport status
The status command opens a live dashboard view and refreshes host and deployment information on a timer.
Web Metrics Flow
The backend exposes metrics at the API layer and pushes data into the dashboard and TUI.
Practical Use
- Check the host before deploying a new service
- Watch resource pressure while a container or PM2 process is starting
- Correlate deployment failures with host load and logs
Related Commands
terminal
skyport status
skyport logs <deployment-id>
skyport docker ps
skyport pm2 list